Skip to main content
 Rapita System Announces New Distribution Partnership with COONTEC
 Rapita partners with Asterios Technologies to deliver solutions in multicore certification
 SAIF Autonomy to use RVS to verify their groundbreaking AI platform
 RVS gets a new timing analysis engine
 How to measure stack usage through stack painting with RapiTest
 What does AMACC Rev B mean for multicore certification?
 How emulation can reduce avionics verification costs: Sim68020
 How to achieve multicore DO-178C certification with Rapita Systems
 How to achieve DO-178C certification with Rapita Systems
 Certifying Unmanned Aircraft Systems
 DO-278A Guidance: Introduction to RTCA DO-278 approval
 The EVTOL Show
 NXP's MultiCore for Avionics (MCFA) Conference
 Embedded World 2026
 XPONENTIAL 2026


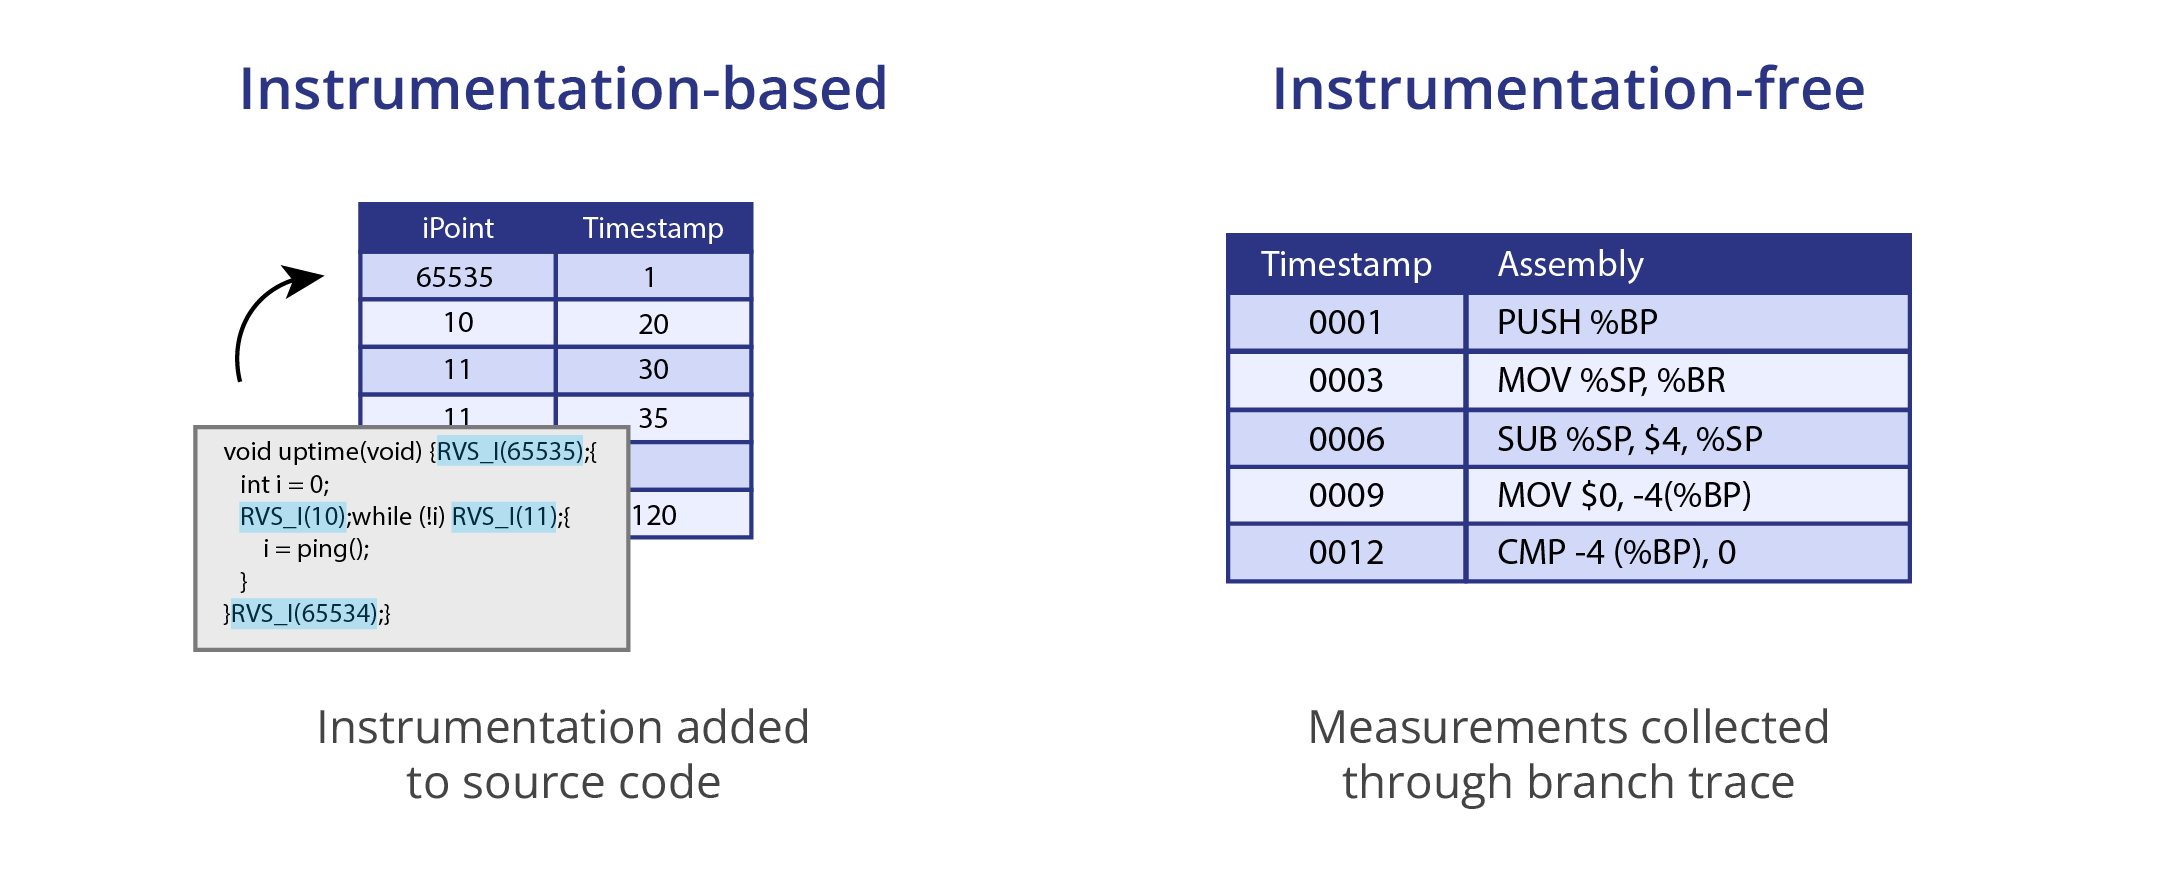
When making timing measurements of software, there are generally two classes of approach:
- Instrumentation-based approaches, where instrumentation is compiled into the code to make measurements, like that used by RapiTime
- Instrumentation-free approaches, which leverage debug circuitry available in some processors to extract a branch trace from which timing information can be derived, like that used by RapiTime Zero
But which is best?
A number of factors are in play, and each method has advantages and disadvantages. Let's explore them.
Instrumentation overheads
A key concern when making on-target measurements of software is the overhead of making measurements. When additional code is being injected into the software to provide the instrumentation, this can add to both the size of the code and the execution time. This is a major disadvantage of instrumentation-based methods - there can be a significant probe effect that can perturb the software being measured. When injected instrumentation is used, care must be taken to ensure that the instrumentation isn't overly intrusive and doesn't cause an undue probe effect. This can place restrictions on the achievable granularity of the instrumentation.
Conversely, using branch traces to derive timing information requires no instrumentation, and will usually have no direct effect on the software being measured. That's one point to instrumentation-free approaches!

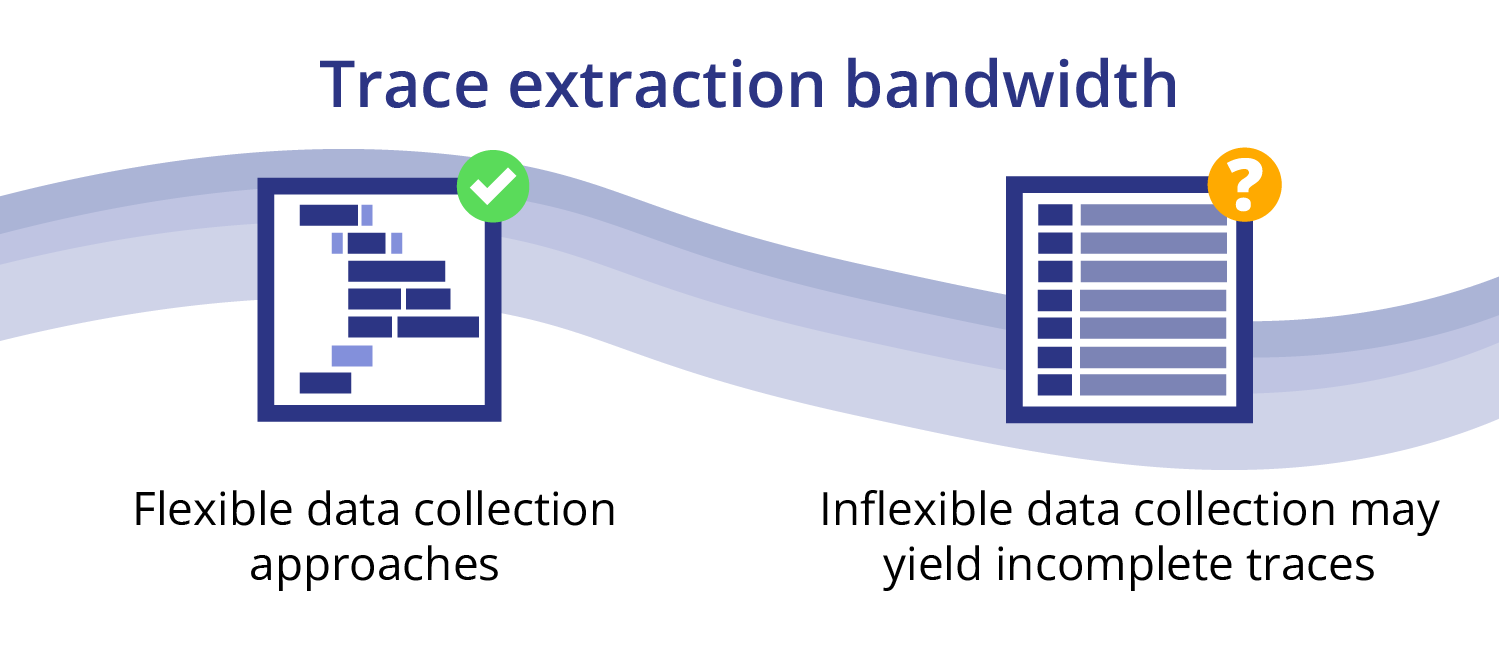
Trace extraction bandwidth
When traces are being extracted from a target, the bandwidth of the extraction mechanism is really important.
When an instrumentation-based approach is used, the depth of instrumentation can be controlled to suit any bandwidth constraints on the trace extraction mechanism.
However, when using a branch trace, the bandwidth required to extract the traces is driven solely by the frequency of branches in the executing code and the rate at which the code is executed.
For a multicore processor executing at multi-GHz clock frequencies, collecting branch traces from multiple cores can very readily overwhelm the bandwidth of the trace circuits. Even for more modest multicore targets that are well over a decade old, this can be a real problem. Because there is no means of controlling the depth of instrumentation or bandwidth of branch trace being generated, the result of exceeding the available trace bandwidth is usually the branches are missed and the resulting trace is incomplete. This incomplete trace may be:
- So incomplete it's impossible to parse it.
- Parseable/recoverable, but missing branches at locations relevant to the timing properties we want to measure.
- Parseable/recoverable, but missing branches such that it's not always possible to tell which path was taken between two branches that weren't lost.
Looks like that's a point to instrumentation-based approaches.
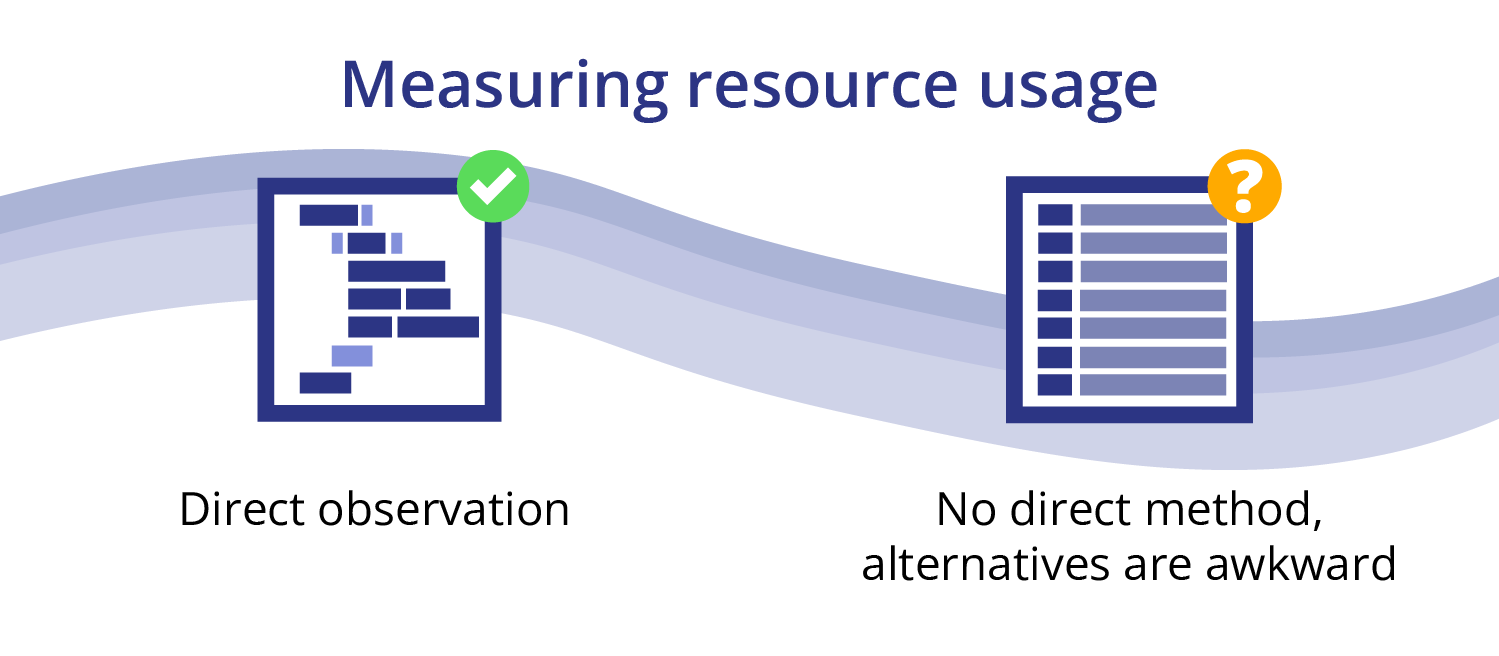
Measuring resource usage
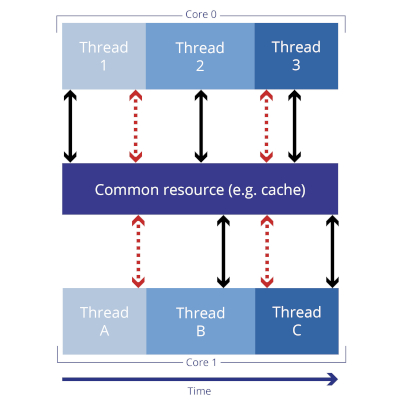
When meeting the objectives of A(M)C 20-193 for multicore processors, it's necessary to measure resource usage as well as timing behavior. If instrumentation is used, the instrumentation can be modified to read performance monitoring counters, and this resource usage information can be encoded into the execution trace. When additional resource usage data are being collected, the bandwidth required for tracing will be larger, but this can be managed in the same way as when only timing data is being collected.
Unfortunately, there's no direct mechanism to collect resource usage information from a branch trace. There are a couple of options to work around this, but both have significant drawbacks.
It is possible to set breakpoints in some code when a branch trace is being collected. At these breakpoints, the debugger can be scripted to collect resource usage information and store this somewhere such that it can be combined after the fact with the branch trace to provide both timing and resource usage information. However, when there is more than one core involved, this depends upon the assumption that cycle-accurate cross-triggering between cores is available. In any processor that allows different cores to execute at different clock speeds (many do), the concept of cycle-accurate cross-triggering doesn't even make sense any more. Additionally, the assumption that the act of breaking and resuming execution has no effect on the internal state of the processor may not be true.
The alternative approach to the instrumentation-free collection of resource usage data is using the debugger to periodically poll the performance counters while the processor is running. While this avoids issues related to breakpoints, it does mean that there is no direct traceability between the resource usage measurements and the code that was executing during the measurement. If a context switch occurs between two measurements of resource usage, it is not possible to attribute the resource usage to one task or another. Additionally, it may not be possible to make measurements of resource usage completely non-intrusively, and it also consumes additional bandwidth on the debugger (which may cause issues with the branch traces).
Now that's instrumentation-based: 2, instrumentation-free: 1.
Summing up
In conclusion, there's no 'best' method of collecting results for multicore timing analysis - both instrumentation-based and instrumentation-free, branch trace-based approaches have advantages and disadvantages.
An instrumentation-based approach is the clear winner when it comes to the flexibility of trace extraction, the control of the level of information being generated, and the collection of resource usage measurements, while the branch trace-based approach shines when assessed in terms of the measurement overhead.
There are some cases where instrumentation is the most appropriate approach, and others where using branch traces will yield better results. Occasionally, it may be that using a combination of both methods can leverage the advantages of both.
The Rapita Verification Suite supports both options: RapiTime is an instrumentation-based timing and resource usage analysis tool, and RapiTimeZero is a branch trace-based timing analysis tool. Rapita experts can help select the most appropriate timing analysis approach for your project.
DO-178C webinars

White papers
Mitigation of interference in multicore processors for A(M)C 20-193

Developing DO-178C and ED-12C-certifiable multicore software

Efficient Verification Through the DO-178C Life Cycle

A Commercial Solution for Safety-Critical Multicore Timing Analysis
Related blog posts

How to certify multicore processors - what is everyone asking?
.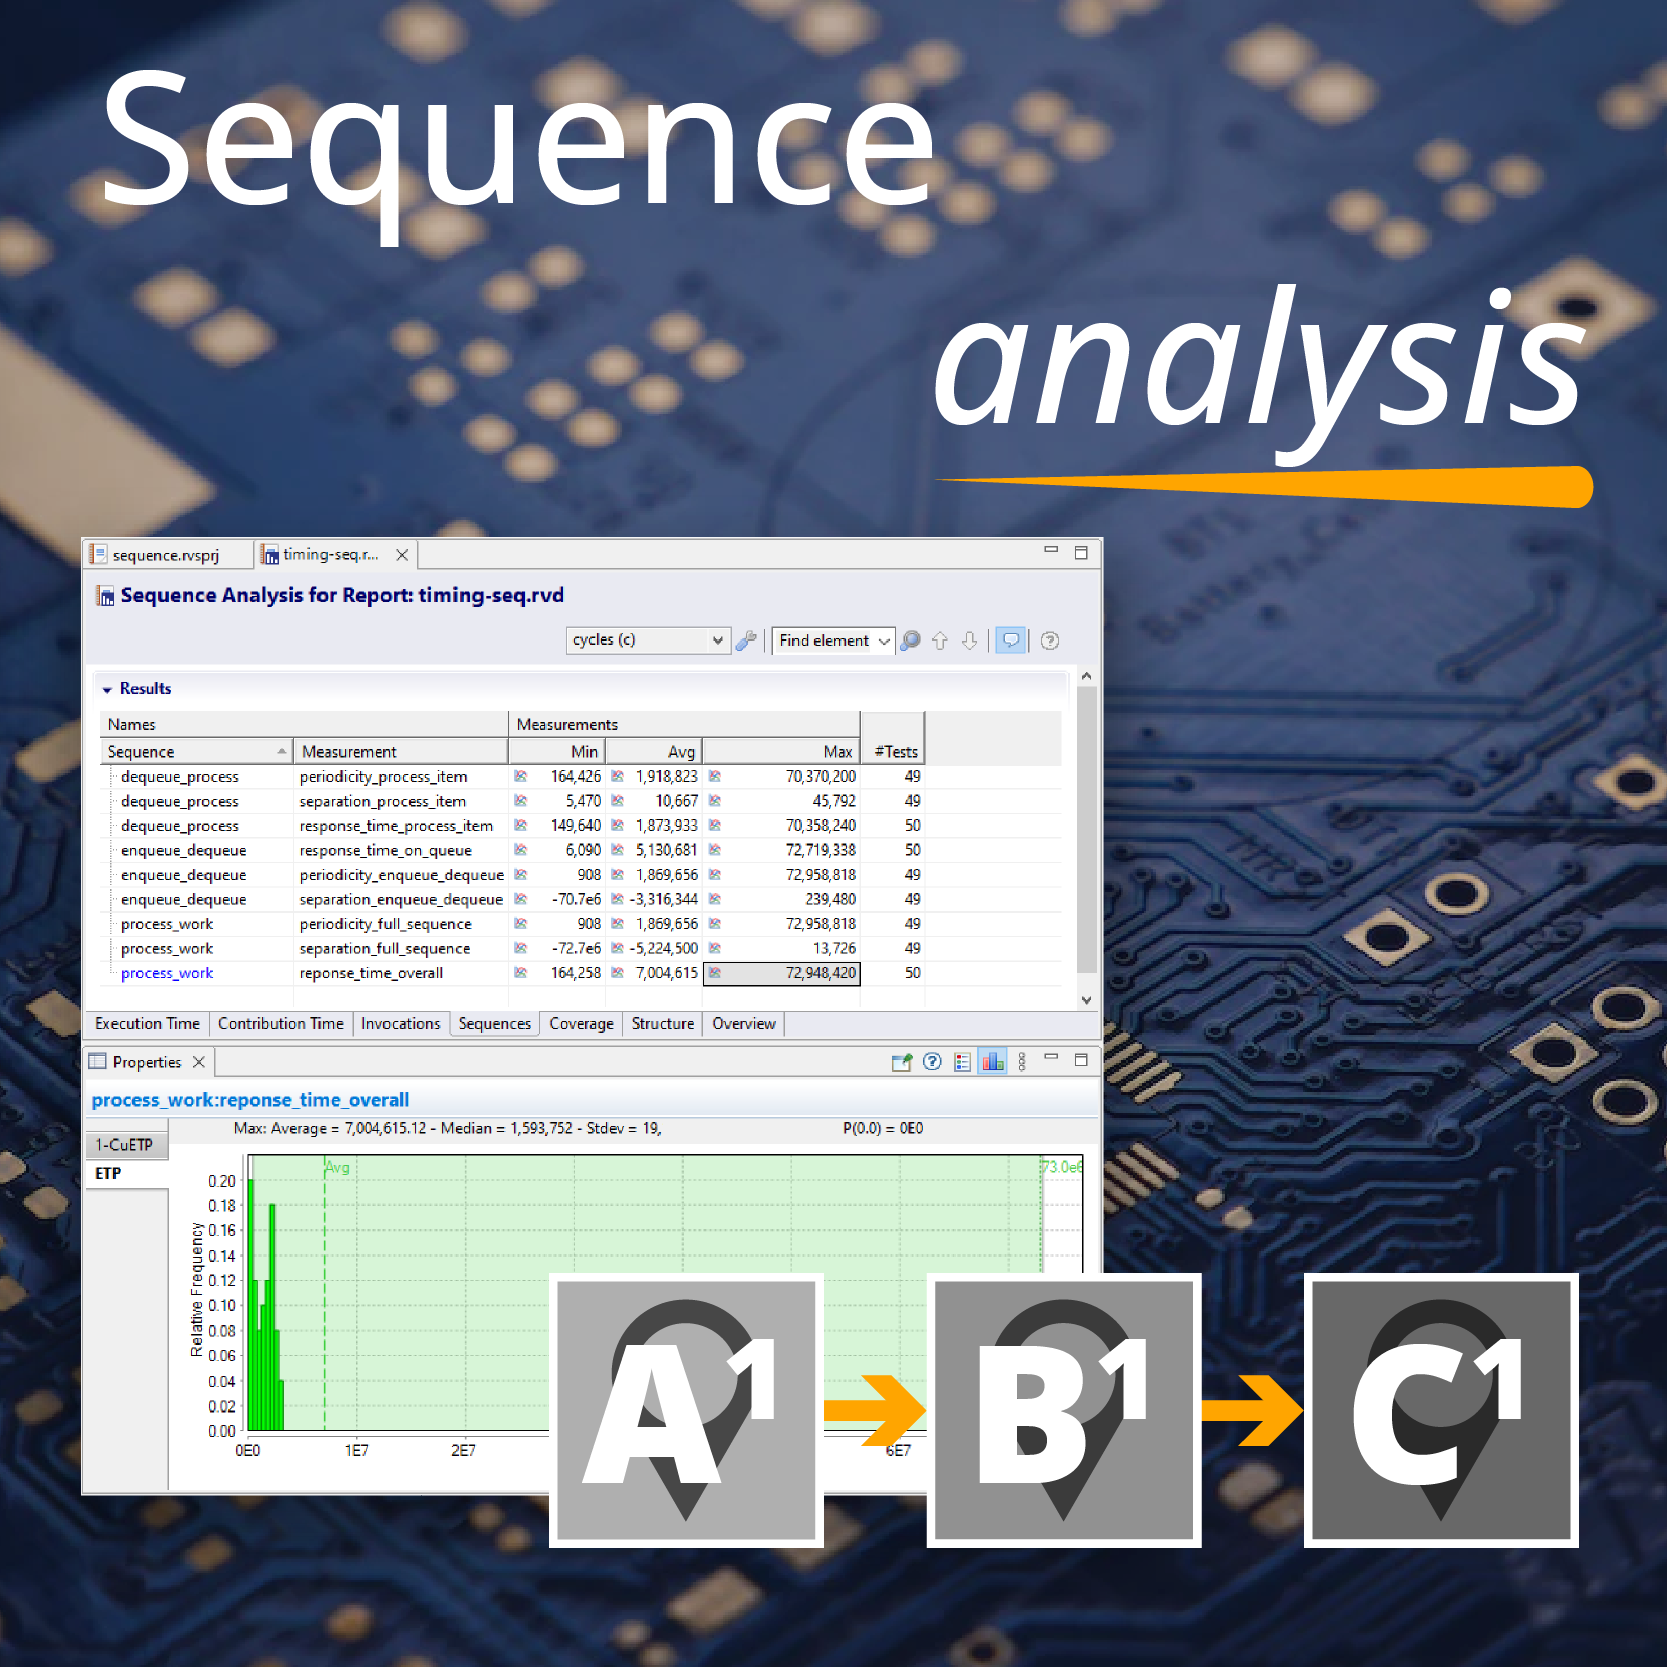
Measuring response times and more with RapiTime
.
Why mitigating interference alone isn’t enough to verify timing performance for multicore DO-178C projects
.
Robust partitioning for multicore systems doesn’t mean freedom from interference
.