Skip to main content
 RVS 3.24 accelerates multicore software verification
 Rapita Systems and Avionyx Announce Strategic Partnership to Offer Best-in-class Avionics Solutions
 Rapita System Announces New Distribution Partnership with COONTEC
 Retro gaming with the Sim68020
 RVS gets a new timing analysis engine
 How to measure stack usage through stack painting with RapiTest
 What does AMACC Rev B mean for multicore certification?
 How to achieve multicore DO-178C certification with Rapita Systems
 How to achieve DO-178C certification with Rapita Systems
 Certifying Unmanned Aircraft Systems
 DO-278A Guidance: Introduction to RTCA DO-278 approval
 Avionics and Testing Innovations
 Certification Together International Conference (CTIC)
 HISC 2026


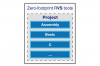
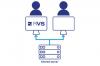
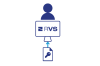
Zero-footprint timing analysis for critical software
Collect timing metrics from systems that produce branch traces
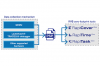
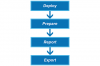
By automatically producing software timing metrics from branch traces, RapiTimeZero reduces the effort needed to verify software timing behavior. Along with branch traces produced by the system hardware, RapiTimeZero only needs a disassembly of the application, meaning there’s no need for either source code or instrumentation.
The high-water mark execution time results produced by RapiTimeZero help you produce evidence that your code meets it timing deadlines.
Identify code to optimize for worst-case behavior
Optimizing code to improve average case performance often has little effect, and may even have a negative effect, on worst-case timing behavior.
RapiTimeZero helps you identify the code elements that have the highest contribution to your overall execution time. This helps you focus your optimization efforts on the sections of code for which it’s most likely to affect your code’s overall behavior.
Debug rare timing events
During program execution, many events occur, and debugging the source of issues like rare timing events can be like searching for a needle in a haystack.
RapiTimeZero helps you debug rare timing events in your code by letting you step through your program execution step by step as you would with a code debugger.
Simplify verification through integration with your continuous test tool
Keep your verification on track by using RapiTimeZero alongside your continuous integration tool. Collect timing results and track your project’s progress over time with our integrations for Jenkins and Bamboo.
By analyzing your code with RapiTimeZero on every new build, you can easily identify anomalies in execution time results as they happen.
Analyze timing behavior of libraries without source code
RapiTimeZero lets you analyze the timing behavior of third-party libraries or other pieces of software for which you have no access to the source code.
As RapiTimeZero analyzes a branch trace and a disassembly to produce timing results, it can produce results even when you don’t have access to source code.
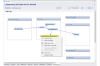
Product features
-
 Zero footprint execution time analysis Zero footprint timing analysis for critical software.Discover this feature
 -
 Source to object code traceability Trace results collected from analyzing program execution to source code, where available.Discover this feature
 -
 Platform support Supported compilers, instruction sets, trace capture mechanisms and RTOSs.Discover this feature
 -
 Produce certification evidence Produce evidence for certification.Discover this feature
 -
 Optimize code for timing performance Easily identify code with the the greatest impact on timing performance.Discover this feature
 -
 Automatically merge timing results Merge timing data from different builds or test runs automatically.Discover this feature
 -
 Automate testing on host and target Run tests on host computers and test rigs in continuous build environments.Discover this feature
 -
 Analyze code complexity Analyze the complexity of your source code.Discover this feature
 -
 Efficient integration workflow Efficient integration workflow and inbuilt Platform Support Packages for integrations.Discover this feature
 -
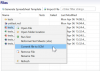
 RVS Project Manager Take your test project from creation to completion with an intuitive user-interface.Discover this feature
 -
 Shared integration with zero-footprint RVS tools After integrating one zero-footprint RVS tool to work a development environment, it is trivial to use others.Discover this feature
 -
 Portable test environments Multiple users can share the same test environment.Discover this feature
 -
 Customizable workflow Customize the RVS workflow to best meet your needs.Discover this feature
 -
 Template integrations Create and use template integrations to reduce your effort integrating RVS with your system.Discover this feature
 -
 Compare reports Compare reports from different builds to track project progress over time.Discover this feature
 -
 Configurable export formats Export timing results in a variety of formats.Discover this feature
 -
 Customizable color scheme Customize the color scheme used to display your results.Discover this feature
 -
 Comprehensive verification toolsuite One tool to meet all your software verification needs.Discover this feature
 -
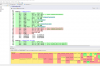
 View detailed timing metrics at a glance Specialized charts and tables make it easy to focus your analysis.Discover this feature
 -
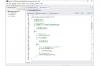
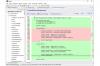
 Code viewer View code with syntax highlighting and color-coding of results.Discover this feature
 -
 Rewind Trace Step through execution traces to investigate timing events using a debugger-like interface.Discover this feature
 -
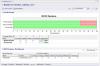
 Execution Time Profile Chart View a histogram of your software's timing behavior to easily identify patterns.Discover this feature
 -
 Aggregate Profile Chart A configurable chart helps you visualize timing data in the context of your code's call tree.Discover this feature
 -
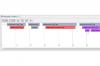 Invocation Timeline Chart A timeline of your invocations helps you visualize the order of calls and how long each took to execute.Discover this feature
 -
 Easily filter results Easily filter results to focus your analysis.Discover this feature
 -
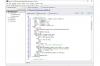
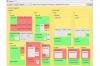 Treemaps View coverage and hierarchy of code at a glance.Discover this feature
 -
 Visualize call dependencies Visualize the call dependencies in your code.Discover this feature
 -
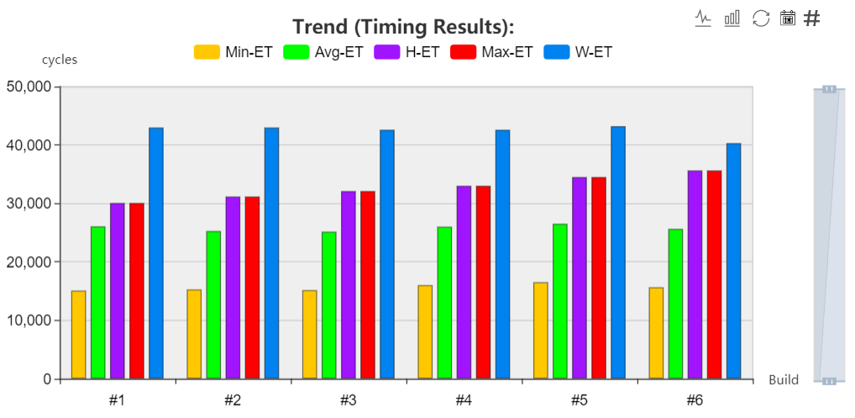
 View trends over time Follow verification results over time in CI servers and beyond.Discover this feature
 -
 Advanced search function Search reports for specific elements using advanced queries.Discover this feature
 -
 Jenkins Run RVS automatically through Jenkins to collect and archive results.Discover this feature
 -
 Bamboo Run RVS automatically through Bamboo to collect and archive results.Discover this feature
 -
 Software Configuration Management Integration with Software Configuration Management tools ensures that files can be used across a team.Discover this feature
 -
 Comprehensive language support Support for all languages that target machine code through zero-footprint analysis.Discover this feature
 -
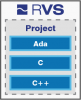
 C Support for verification of code written in C.Discover this feature
 -
 C++ Support for verification of C++ code.Discover this feature
 -
 Ada Support for verification of code written in Ada.Discover this feature
 -
 Assembly Support for verification of Assembly code.Discover this feature
 -
 Mixed language support Support for verification of code written in multiple languages.Discover this feature
 -
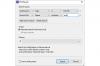
 Flexible licensing options Select floating or node-locked licenses with annual or perpetual duration.Discover this feature
 -
 Floating licenses Floating licenses support multiple users and shared working environments.Discover this feature
 -
 Node-locked licenses Node-locked licenses support the use of RVS on a single machine.Discover this feature
 -
 Annual licenses License RVS in annual increments.Discover this feature
 -
 Perpetual licenses License RVS for use indefinitely.Discover this feature
 -
 Easy to get started Integration and learning resources help you get started verifying your code in no time.Discover this feature
 -
 Support Dedicated support service to resolve technical issues quickly.Discover this feature
 -
 Tutorials Learn how to get the most from our verification solutions with simple, interactive tutorials.Discover this feature
 -
 Examples and sandbox projects Examples and sandbox projects help you get started quickly.Discover this feature
 -
 Training Get up to speed with custom training courses delivered by expert engineers.Discover this feature
 -
 Documentation Learn how to use RVS features with comprehensive documentation in both printed and electronic formats.Discover this feature
 -
 Help search Search the help system to find the most relevant resources quickly.Discover this feature
 -
 Easily migrate to new versions Easily migrate to new RVS versions with guided migration help.Discover this feature
 -
 Multicore support Verify critical multicore systems.Discover this feature


Downloads
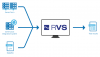
Zero-footprint RVS tools such as RapiCoverZero reconstruct information on the behavior of an application when it runs by using branch trace information captured from the platform the application is running on and combining this with information obtained from a disassembly of the application. Visit our platform support page to learn more.
68k
Instruction Sets
Zero-footprint RVS tools can analyze disassembled code for the 68k instruction set.
AArch64
Instruction Sets
Zero-footprint RVS tools can analyze disassembled code for the AArch64 instruction set.
Ada
Programming Languages
RVS can be used to verify Ada code for requirements-based testing, structural coverage, execution time and scheduling behavior.

Model-Based Design
RVS can be used for on-target verification of code generated by ANSYS® SCADE® and for verification of manually written code in Ansys SCADE projects.
RVS automatically converts model-based tests written in SCADE Test into on-target verification tests, ensuring an efficient workflow through MIL to HIL testing.

CPU
RVS can be used to analyze software running on Arm CPUs.
RVS tools can be used to analyze software run on any host operating system or embedded target (as long as a communication channel is available). The following is a non-exhaustive list of Arm CPUs we have worked with:
- ARM7
- ARM9
- ARM10
- ARM11
- Cortex-M
- Cortex-R
- Cortex-A
Arm Compiler
Compilers
Zero-footprint RVS tools are compatible with object code compiled by the Arm Compiler.
Arm instruction set
Instruction Sets
Zero-footprint RVS tools can analyze disassembled code for the arm instruction set.
Assembly
Programming Languages
RVS can be used to verify Assembly code for structural coverage, execution time and scheduling behavior.

CPU
RVS can be used to analyze software running on Atmel CPUs.
RVS tools can be used to analyze software run on any host operating system or embedded target (as long as a communication channel is available). The following is a non-exhaustive list of Atmel CPUs we have worked with:
- AT90CAN128

Software Configuration Management (SCM)
RVS tools work with projects using Azure DevOps for Software Configuration Management.

Software Configuration Management (SCM)
You can run RVS automatically through the Bamboo continuous integration server.
Bare Metal
RTOS
RVS (including zero-footprint tools) supports the verification of code running on Bare Metal (no OS).

Software Configuration Management (SCM)
RVS tools work with projects using BitBucket for Software Configuration Management.
C
Programming Languages
RVS can be used to verify C code for requirements-based testing, structural coverage, execution time and scheduling behavior.
C++
Programming Languages
RVS can be used to verify C++ code for requirements-based testing, structural coverage, execution time and scheduling behavior.
CC-RH850
Compilers
Zero-footprint RVS tools are compatible with object code compiled by the CC-RH850 compiler.
Clang
Compilers
Zero-footprint RVS tools are compatible with object code compiled by the Clang compiler.
Cobertura
Software Configuration Management (SCM)
RapiCover lets you export structural coverage results in a Cobertura format.
Comprehensive language support
Programming Languages
Zero footprint RVS tools can be used to analyze software in any language that targets machine code.
As zero-footprint RVS tools analyze the final executable rather than the source code, they can do so whether they were written in Assembly, BASIC or C.

Requirements Traceability
RapiTest lets you import requirements from DOORS through ReqIF.

CPU
RVS can be used to analyze software running on ESA CPUs.
RVS tools can be used to analyze software run on any host operating system or embedded target (as long as a communication channel is available). The following is a non-exhaustive list of ESA CPUs we have worked with:
- LEON2

RTOS
RVS (including zero-footprint tools) support the verification of code using ESOL eMCOS.

RTOS
RVS (including zero-footprint tools) supports the verification of code using FreeRTOS.

CPU
RVS can be used to analyze software running on FRONTGRADE Gaisler (previously known as Cobham Gaisler) CPUs.
RVS tools can be used to analyze software run on any host operating system or embedded target (as long as a communication channel is available). The following is a non-exhaustive list of FRONTGRADE Gaisler CPUs we have worked with:
- LEON3
- LEON4
GCC
Compilers
Zero-footprint RVS tools are compatible with object code compiled by the GCC compiler.

Software Configuration Management (SCM)
RVS tools work with projects using GitHub for Software Configuration Management.

Software Configuration Management (SCM)
You can run RVS automatically through continuous integration pipelines in GitLab.

CPU
RVS can be used to analyze software running on IBM CPUs.
RVS tools can be used to analyze software run on any host operating system or embedded target (as long as a communication channel is available). The following is a non-exhaustive list of IBM PowerPC implementations we have worked with:
- G1 (601)
- G2 (602, 603, 604, 620)
- G3 (740/750)
- 7xx/750 family
- G5/970 series
- 401
- 403
- 405
- 440 range
IBM Engineering Rhapsody
Model-Based Design
RVS can be used for on-target verification of code generated by IBM Engineering Rhapsody and for verification of manually written code in IBM Engineering Rhapsody projects.

CPU
RVS can be used to analyze software running on Infineon CPUs.
RVS tools can be used to analyze software run on any host operating system or embedded target (as long as a communication channel is available). The following is a non-exhaustive list of Infineon CPUs we have worked with:
- XE166 family
- XC 2000 family
- C166 family
- TriCore
- TriCore Aurix
- TriCore Aurix Gen2
- XMC1000

Requirements Traceability
RapiTest has a dedicated integration with the Jama Connect® requirements management and traceability tool.

Software Configuration Management (SCM)
You can run RVS automatically through the Jenkins continuous integration server.

Software Configuration Management (SCM)
RapiTest lets you export functional test results in the JUnit format.
Lauterbach TRACE32
Debuggers
Zero-footprint RVS tools are with branch traces collected using the Lauterbach TRACE32.
For it to be possible to analyze executables generated by a platform by zero-footprint RVS tools, it must be possible to collect a branch trace from the platform*. Some targets generate branch traces by default, for example:
- Boards that have been developed to meet at least Class 2 of the Nexus message-based trace protocol
- ARM boards including an ARM ETM component
- Custom boards developed to produce branch traces
A debugger may be used to collect these branch traces from the target. Each Platform Support Package (PSP) is designed to support branch traces collected by a specific debugger.
We can develop support for other debuggers and simulators. For more information, contact us at
Linux
OS (Host)
RVS can run on variety of Linux distributions (including Ubuntu and Red Hat).
For older operating systems, contact us.

Model-Based Design
RVS can be used for on-target verification of code generated by Mathworks Simulink and for verification of manually written code in Mathworks Simulink projects.
Microsoft TFS
Software Configuration Management (SCM)
RVS tools work with projects using Microsoft TFS for Software Configuration Management.

CPU
RVS can be used to analyze software running on Freescale/NXP CPUs.
RVS tools can be used to analyze software run on any host operating system or embedded target (as long as a communication channel is available). The following is a non-exhaustive list of Freescale (NXP) CPUs we have worked with:
- 68000
- 680x0
- ColdFire
- M-CORE
- Power Architecture (MPC5xx, MPC55xx, MPC56xx, MPC57xx)
- ARM Cortex-M microcontrollers (Kinetis E series, Kinetis K series, Kinetis L series, Kinetis M series, Kinetis W series).
- 56k DSP family
- QorIQ (P2010, P2020, P4080, P5010, P5020, P5021, P5040, T2080)
PARTNER-Jet2
Debuggers
Zero-footprint RVS tools are with branch traces collected using the PARTNER-Jet2.
For it to be possible to analyze executables generated by a platform by zero-footprint RVS tools, it must be possible to collect a branch trace from the platform*. Some targets generate branch traces by default, for example:
- Boards that have been developed to meet at least Class 2 of the Nexus message-based trace protocol
- ARM boards including an ARM ETM component
- Custom boards developed to produce branch traces
A debugger may be used to collect these branch traces from the target. Simulators may generate branch traces, or it may be possible to modify them to do so. Each Platform Support Package (PSP) is designed to support branch traces collected by a specific debugger or from a specific simulator. The debuggers and simulators PSPs already support are listed below:
We can develop support for other debuggers and simulators. For more information, contact us at

RTOS
RVS (including zero-footprint tools) supports the verification of code using SYSGO PikeOS.

Requirements Traceability
RapiTest supports integration with the Polarion® ALM™ requirements management and traceability tool.
PowerPC
Instruction Sets
Zero-footprint RVS tools can analyze disassembled code for the PowerPC instruction set.
QEMU
Simulators
Zero-footprint RVS tools support the verification with branch traces generated using the a modified version of the QEMU simulator.

Requirements Traceability
RapiTest integrates with requirements management software that can produce ReqIF format results.

Requirements Traceability
RapiTest lets you import requirements from Reqtify through ReqIF.
RH850
Instruction Sets
Zero-footprint RVS tools can analyze disassembled code for the RH850 instruction set.
SafeRTOS
RTOS
RVS (including zero-footprint tools) supports the verification of code using SafeRTOS.

Software Configuration Management (SCM)
RVS tools work with projects using TeamCity for Software Configuration Management.

CPU
RVS can be used to analyze software running on Texas Instruments CPUs.
RVS tools can be used to analyze software run on any host operating system or embedded target (as long as a communication channel is available). The following is a non-exhaustive list of TI CPUs we have worked with:
- TMS320C6x family
- TMS320C28x family
- TMS320F28x family
- TMS570 family
VISUM
Instruction Sets
Zero-footprint RVS tools can analyze disassembled code for the VISUM instruction set.

Requirements Traceability
RapiTest lets you import requirements from Visure through ReqIF.
Windows
OS (Host)
RVS can run on Windows 10 and 11.
For older operating systems, contact us.
Windows Server
OS (Host)
RVS can run on Windows Server 2019 and above.
For older operating systems, contact us.
x86
Instruction Sets
Zero-footprint RVS tools can analyze disassembled code for the x86 instruction set.
Instrumentation-based vs instrumentation-free analysis
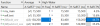
Both RapiTime and RapiTimeZero support on-target worst-case execution time analysis for critical software. Depending on your project and needs, one or both solutions may be better for you. Consult the table below to determine which is best for your project.
|
Features |

|
|
|---|---|---|
|
Works without source code |
No |
Yes |
|
Works without Instrumentation |
No |
Yes |
|
Integration with development environment |
Integration needed |
No integration needed |
|
Tool qualification support |
Yes |
In development - contact us for details |
|
Trace size and data processing time |
Depends on applied instrumentation |
Typically larger trace and longer data processing times |
|
Supported platforms (target, data collection mechanism) |
Flexible, almost any platform supported (see compatibility) |
Requirements on platform (branch trace and context switch information must be available), PSP (see compatibility) |
Frequently asked questions
-
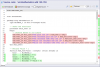
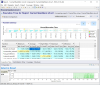
How are my results presented?
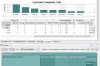
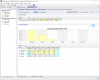
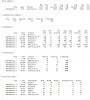
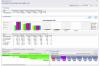
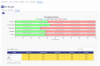
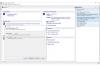
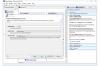
All RVS tools include a friendly user-interface that presents your data in both tabular and graphical formats. Using this interface, you can filter your results to zoom in on target functions, making it easy to find the information you are looking for.
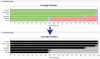
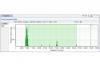
RapiTime includes charts designed to help you easily understand your data:
- Its Treemaps provide a high-level overview of your code base and help you understand the timing behavior of your code at a glance.
- Its Invocation Timeline and Aggregate Profile Charts let you visualize your results in of your code's call tree, identify the calls with the highest execution times, and investigate specific timing events more easily.
You can view RapiTime and RapiTimeZero results in continuous integration software, allowing you to track your verification results over time.
-
How large a code base can RVS tools handle?
RVS tools are designed to handle very large code bases. Because of the efficient algorithms used by RVS tools, there is no fundamental limitation to the number of lines of code that RVS can process, and our RVS tools have been used on projects with millions of lines of code.
-
How are RVS products licensed?
We offer both “Node-locked” and “Floating” licenses, and a license server to support use of our tools in your specific development environment.
For more information on our licensing models, see our RVS licensing FAQs.
-
What happens if I encounter an issue while using an RVS tool?
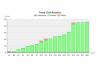
All RVS licenses include access to our dedicated in-house support team, who will work with you to provide a rapid fix to your issue. This is a critical part of our vision. During 2021, we resolved 63% of our support requests within 7 working days and 93% within 30 working days. We also inform our customers of known issues via our website and email.
-
How do you support RVS users?
We provide an extensive set of RVS documentation with each of our products, and offer training courses guiding you through the most effective use of RVS tools. All our users can benefit from privileged access to our website, which includes downloads for new product releases.
-
What is RapiTime Zero?
RapiTimeZero is an execution time analysis tool that requires no project source code or modification of the development environment being used. To extract execution time information, RapiTimeZero analyzes branch trace information collected from a compatible target or data collection mechanism.
As part of the RVS toolsuite, it forms part of a software verification solution that also includes tools for structural coverage analysis and functional testing.
-
How does RapiTime Zero work?
RapiTimeZero uses two types of inputs from which to analyze software execution times. The first is the executable file and a disassembly of it, and the second is a branch trace collected while the program under analysis is executed. From these inputs, RapiTimeZero can understand both the program structure and the events that occurred during the program execution, allowing it to perform execution time analysis and produce execution time results.
-
Which types of timing data does RapiTime Zero report?
RapiTimeZero collects and reports data on your code’s worst-case-execution time, high water mark path, and reports minimum, average and maximum execution times for each test.
-
Can I use RapiTime Zero to analyze the timing behavior of multicore architectures?
As with all RVS tools, RapiTimeZero supports data collection on multicore architectures. To analyze the timing behavior of multicore architectures, RapiTimeZero simply needs to know which branches corresponded to which core during program execution. This information can either be inferred by providing an individual branch trace for each core, or a combined trace that includes information on the core on which each branch was taken.
-
How does RapiTime Zero help me investigate timing behavior?
RapiTimeZero includes a Rewind Trace utility, which lets you step through the events that occurred during program execution like you can with a debugger. This lets you set breakpoints and easily analyze the execution of your program.
-
Which languages does RapiTime Zero support?
As RapiTimeZero analyzes object code directly to produce results, it supports any language that targets machine code.
-
How do I learn more about RapiTime Zero?
You can request a trial version of RVS, which includes RapiTimeZero. You can also arrange a demonstration, where a member of our team will work with you to show the benefits that RapiTimeZero can offer you.
-
Which platforms and data collection mechanisms do zero-footprint RVS tools support?
Software analysis by zero-footprint RVS tools has the following requirements:
- The platform (target and any external devices e.g. debuggers) must be capable of producing a branch trace without gaps to ensure that the full program trace can be reconstructed.
- The OS needs to make context switches observable. For some systems, supporting this may require modifications to be made to the OS.
- A Platform Support Package (PSP) is needed for RVS to interface with the platform, including the target hardware and trace capture mechanisms, in order to convert the branch trace into a format that the RVS tool understands and disassemble the executable and parse the resulting object code. PSPs are developed to be compatible with four components of the platform: Compilers, Instruction sets, Branch traces and Real-time operating systems.
For more information on the requirements for software analysis by zero-footprint RVS tools and a list of currently supported platforms, see our Platform support page.
For more detailed information on the requirements, see our Technical note.
-
Can I view my results in the context of my project source code?
If your source code is available, yes. By importing your source code and debug symbols into your RVS project, you can view your results in the context of both your object and source code, and trace between them.
-
Can I use RVS tools with my continuous integration environment?
RVS integrates with a range of continuous integration tools, allowing you to collect unit test, coverage and execution time results with every new build, track your verification progress over time and easily identify anomalies in your software's behavior as they are introduced.
RapiTest, RapiCover and RapiTime (including zero-footprint versions) include custom plugins to integrate with Jenkins and Bamboo. RapiTest and RapiCover results can also be displayed in a range of other continuous integration tools through the JUnit and Cobertura plugins, which are compatible with most continuous integration software.
-
How long has RVS been used for software verification?
The Rapita Verification Suite (RVS) has been used in the critical embedded industry for over 15 years and supported a number of avionics projects globally. Qualification kits for qualified RVS products have supported more than 20 DO-178B and C certification projects up to and including DAL A.
-
Can statistical modeling approaches be used to provide support for timing measurements?
In general, statistical modeling approaches are not applicable to timing analysis of software as software timing behavior does not fit standard statistical assumptions.
In some cases, software timing behavior may fit standard statistical assumptions, but this is the exception rather than the rule and must be proven before relying on results from statistical modeling.
-
How does RVS support Enterprise licensing?
Floating RVS licenses follow an “Enterprise” model. You can use them across geographical boundaries*, in different projects, with different users, and share them with suppliers working on the same project.
*Some floating licenses may be restricted to use within a specific geographical region. Where this is the case, this is agreed before licenses are issued.
-
What are Platform Support Packages and why are they needed?
Platform Support Packages are required to support software analysis by zero-footprint RVS tools. They interface between the tools and the platform in order to do the following:
- Convert the specific format of native branch traces generated by the platform into a format that the RVS tool understands and can use for subsequent analysis.
- Disassemble the object code to understand the structure and control flow of the code so this can be used for subsequent analysis.
Each PSP is designed to support various components of a platform. These include:
- The compiler(s) used to generate executables
- The instruction set of object code to be analyzed
- The native branch trace format generated from the platform – this depends on the mechanism used to generate branch traces, which may be the target hardware (or simulator) or a third-party device e.g. debugger.
- The real-time operating system.
Different PSPs are needed to support analysis by zero-footprint RVS tools when any of the above items are different between two platforms. For more information on how PSPs support analysis by zero-footprint RVS tools, see our Requirements for zero-footprint RVS analysis Technical note.
-
Is a Platform Support Package available for my platform?
To see whether we have already developed PSPs compatible with the components on your platform, see our zero-footprint Platform support.
If we have not yet developed PSPs compatible with one or more components of your platform, we may be able to develop them. For more information, contact us at info@rapitasystems.com.
-
Can I create and manage groups for my floating RVS licenses?
Yes, you can create and manage groups of users for your floating RVS licenses. You can restrict each group to only serve licenses to specific hostnames or IP addresses. This allows you to reserve licenses for specific groups or specific purposes such as supporting the use of RVS on a continuous integration server.
Any licenses that you don’t reserve will remain available as floating licenses that can be shared among different users and geographic locations.
-
How does RVS support the analysis of shared code compiled by build systems with multiple executables?
RVS supports the analysis of shared code compiled by build systems with multiple executables by letting you specify the source files that will be compiled in each executable.
If you have functions that are declared in multiple components with the same name but have different definitions, RVS can treat each such function uniquely, for example to provide separate coverage in RapiCover and separate execution time results in RapiTime.
-
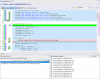
How can RVS help me understand my code base?
RVS analyzes the structure of your code and presents information on your code’s structure, helping you understand your code and its dependencies in a variety of forms such as the following:
- RVS analyzes the McCabe complexity of your code and presents the complexity of each code element, letting you easily identify code with high complexity.
- RVS Treemaps present the hierarchy of your code’s components and source files graphically.
- RVS lets you view and explore the call dependencies in your code.
-
How does RapiTime Zero support results collection from multiple test runs?
RapiTimeZero lets you merge timing results from different test runs into a single report. This supports the collection of timing data from multiple test campaigns, and lets you merge results from different builds, for example system test and low-level test builds, so long as the functions under test are identical.
-
Which certification standards and guidelines can RVS help me to achieve?
RVS supports meeting standards and guidelines for verification of mission and safety-critical applications including:
- Civil aerospace software guidelines DO-178C (ED-12C), DO-278A (ED-109), AC 20-193 & AMC 20-193
- Military & defense aerospace standards MIL-HDBK-516C, AA-22-01 AMACC, EMACC, ADSM, Def Stan 00-55 & Def Stan 00-56
- Automotive standard ISO 26262
- Space software standards NASA-STD-8739.8B, ECSS-E-ST-40C
- Other standards based on IEC 61508, including IEC 62279, EN50128 & EN 50657 (rail), IEC 61511 (industrial processes), IEC 61513 (power), IEC 60880 (nuclear) & IEC 62061 (machinery)
-
Is instrumentation-based or instrumentation-free analysis best for me?
Both RapiTime and RapiTimeZero support on-target worst-case execution time analysis for critical software.
Depending on your project and needs, one or both solutions may be better for you. Consult the table below to determine which is best for your project.
Feature
RapiTime
RapiTimeZero
Works without source code
No
Yes
Works without instrumentation
No
Yes
Integration with development environment
Integration needed
No integration needed
Tool qualification support
Yes
In development - contact us for details
Trace size and data processing time
Depends on applied instrumentation
Typically larger trace and longer data processing times
Supported platforms (target, data collection mechanism)
Flexible, almost any platform supported (see compatibility)
Requirements on platform (branch trace and context switch information must be available), PSP needed (see compatibility)
-
Which DO-178C objectives can RapiTime Zero help me to achieve?
RapiTime Zero can help you meet DO-178C objective 6.3.4.f, which calls for evidence that “Source code is accurate and consistent”, including worst-case execution time analysis.
It can also help you meet DO-178C objective 6.3.3.f “Software partitioning integrity is confirmed” by letting you measure the impact of deliberate attempts to breach partitioning on your software’s timing behavior.
As RapiTime Zero is designed for on-target execution, it also helps you achieve DO-178C objective 6.4.e.
For a detailed description of how RVS tools including RapiTime Zero can help you achieve DO-178C certification, see our web page on how to achieve DO-178C certification.
-
Which DO-178C objectives can RapiCover Zero help me to achieve?
RapiCover Zero can help you meet DO-178C objective 6.4.4.c, which indicates that structural coverage analysis is performed on the software based on requirements-based tests of its behavior. RapiCover Zero supports structural coverage analysis at the statement and decision levels. Since Modified Condition/Decision Coverage examines source-level decisions, it can only be measured on object code in very limited circumstances. Instead, we recommend using RapiCover for full support of all MC/DC source code analysis.
RapiCover Zero justifications help you with DO-178C “structural coverage resolution” by letting you mark coverage holes as justified or covered by analysis.
As RapiCover Zero is designed to collect results from tests run on-target, it also helps you achieve DO-178C objective 6.4.e.
RapiCover Zero (together with RapiCover) can also support meeting the “additional code verification” part of DO-178C objective 6.4.4.c for DAL A software, which indicates that evidence is available for the correctness of additional code introduced by the compiler.
For a detailed description of how RVS tools including RapiCover Zero can help you achieve DO-178C certification, see our web page on how to achieve DO-178C certification.
-
How does RVS help me get started?
RVS make it easy to get started with a range of resources:
- Interactive tutorials guide you through using each RVS tool.
- Example projects, reports and tests let you explore using RVS with example code, while sandbox projects let you plug in Ada, C and C++ snippets and get started with on-host verification quickly.
- If you’re looking for more detail about specific topics, the RVS documentation is at hand.
And no matter what your question, RVS’s help search can link you to the most helpful resources at the click of a button.