Skip to main content
 Rapita Systems Collaborates with Wind River to Break the Multicore Certification Barrier
 Rapita Systems Launches Next Generation of MACH178 for Multicore
 RVS 3.24 accelerates multicore software verification
 Rapita Systems and Avionyx Announce Strategic Partnership to Offer Best-in-class Avionics Solutions
 The Evolution of DO 178 and ED-12 Standards
 Retro gaming with the Sim68020
 RVS gets a new timing analysis engine
 How to measure stack usage through stack painting with RapiTest
 How to achieve multicore DO-178C certification with Rapita Systems
 How to achieve DO-178C certification with Rapita Systems
 Certifying Unmanned Aircraft Systems
 DO-278A Guidance: Introduction to RTCA DO-278 approval
 DO-178C Multicore Virtual Training
 HISC 2026


Introduction
Function pointers present a real problem for static code analysis, including when calculating stack usage. Understanding software stack requirements is an activity that is required for several standards/guidelines including DO-178B and DO-178C. Nevertheless, function pointers are supported and therefore prevalent in most system-level languages (C and Ada both have them, whilst they are used all the time with C++). Any operating system, higher-level function, or middleware providing hooks will usually resort to function pointers for the user-side part of their operation.
Establishing which functions can be called indirectly can be time-consuming and error-prone, especially when done by hand. It is even sometimes impossible to establish manually which functions may be called indirectly - for example when some part of a finished executable has no source available.
In some situations failure to analyze function pointers can even lead to overly optimistic results - for example when stack analysis does not know where to look for sub-calls and therefore assumes an indirect call uses zero stack. Really, the only way to reliably trap function calls is by observation - i.e. dynamic analysis. 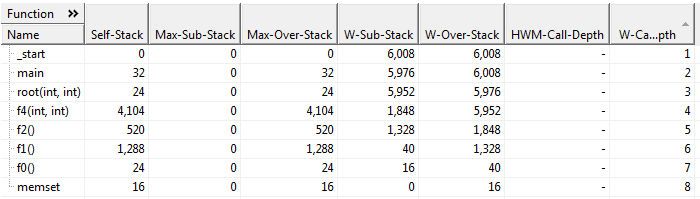
Source and object instrumentation
Function pointer calls can be done through source code analysis when source is available. To be completely thorough though, object code analysis is required. This means looking at the assembly or machine-code level analysis of the compiled source, and has the added benefit of being able to catch all indirect function calls, even if they are made from part of an executable for which no source code exists. It is full of complications though - in order to be meaningful in a report a map must exist between the assembly code that has been analyzed, and the source code it originates from. Luckily debuggers have been doing a good job of providing this kind of mapping for many years and algorithms exist for providing linear-time mappings from assembly to source with relatively low memory overhead.
Recording the results
Each time an instrumented function pointer is seen, a map must be recorded between the origin of the call and the destination function. Some chips and hardware have capabilities for on-chip tracing which helps us to be able to produce a trace of, say, all branch statements made by the processor. Sadly this is not commonplace, and other strategies must be employed in order to extract the required information.
Naively this can be done via a trace - every time a function pointer call is seen the original location of the call and the function being called can be output to a trace. We do this via instrumentation of the code to call tracing functions which store the relevant data. The problem with this, is that the trace is unbounded - observe the same indirect call 2000 times and you will have 2000 records of this in your trace. However, there are only a finite number of combinations of functions and pointers that can be made, bounded by (number of functions * indirect call locations). Therefore, it is straightforward enough to provide a map of caller to callee which updates in linear-time. In fact, if speed and memory are not an issue during your analysis run then a map can be used as good alternative to tracing.
It is also possible to provide constant-time instrumentation as a bitmap (one bit per caller-callee pair) via object-code level instrumentation, where access to the assembly allows more controlled injection of data and instrumentation code.
Identifying indirect calls
One of the major issues with object code analysis is the number of creative (and, thanks to optimization, often employed) ways that a function can be called indirectly. Partly this is down to the processor, and partly down to the compiler.
On the ARM processor, for example, the program counter is just a register that can be written to like any other - any instruction that can alter a register (which is pretty much all of them) can alter the program counter and therefore has the potential to be used for indirect calls. These instructions can be used interchangeably with the return from a subroutine. Ironically the instructions used for direct function calls on the ARM are among the few which are not capable of invoking indirect calls. In addition the instruction to preserve and update the return-from-subroutine register may appear in a variety of forms and is not bound to the updating of the program counter.
An example of a hand-coded indirect function call on the ARM processor:
.indirect_function
STMIA R13!, {R1-R3, R14}  -- Preserve calls
ADR   R14, subcall_return -- Move the address of the return into the link R14
MOV   R0, #15             -- Move the constant 15 into R0
MOV   PC, R1              -- Move the contents of R1 into the program counter
.subcall_return
LDMIA R13!, {R1-R3, PC}   -- Return from this routine, restoring R0-R3 at the same time
Luckily there are some processors, such as the PowerPC, where identification of indirect calls falls to a single dedicated instruction, which is therefore easily identified. Identifying the patterns which a specific compiler uses for indirect function calls (as opposed to other jumps in general - indirect or otherwise) is a task that needs to be performed on a per-compiler basis. Where various binaries from different compilers are packaged together (or even, as is likely with operating systems, hand-coded assembly is provided) this task becomes even more complex, though not impossible.
Conclusion
In conclusion, function pointer analysis is an area fraught with complexity - the more it is looked at, the more corner-cases we find. In order to perform to the most optimal level with the greatest completeness object-code analysis is required; however this comes with its own issues, some of which are considerably harder to deal with than others. You can find out more about tools for worst case stack analysis in the technical note below.
DO-178C webinars

White papers
Mitigation of interference in multicore processors for A(M)C 20-193

Developing DO-178C and ED-12C-certifiable multicore software
Efficient Verification Through the DO-178C Life Cycle

A Commercial Solution for Safety-Critical Multicore Timing Analysis