Skip to main content
 RVS 3.24 accelerates multicore software verification
 Rapita Systems and Avionyx Announce Strategic Partnership to Offer Best-in-class Avionics Solutions
 Rapita System Announces New Distribution Partnership with COONTEC
 RVS gets a new timing analysis engine
 How to measure stack usage through stack painting with RapiTest
 What does AMACC Rev B mean for multicore certification?
 How emulation can reduce avionics verification costs: Sim68020
 How to achieve multicore DO-178C certification with Rapita Systems
 How to achieve DO-178C certification with Rapita Systems
 Certifying Unmanned Aircraft Systems
 DO-278A Guidance: Introduction to RTCA DO-278 approval
 VERTICON 2026
 Embedded World 2026
 Test what you fly - Real code, Real Conditions Webinar
 Avionics Certification Q&A: CERT TALK


Typically, to collect structural coverage results from software tests, you apply instrumentation to source code. But what if you can't apply instrumentation (because you only have access to object code), or just don't want to (to reduce instrumentation overheads and ensure that what you test is what you deploy)?
In this blog, we'll explore some methods we’ve been developing to perform instrumentationless code coverage analysis by using branch traces – traces generated from program execution that contain information on which branches were taken. The methods include one using a machine emulator (QEMU), and another using hardware (Intel Processor Trace).
Zero-instrumentation coverage on an emulator
We modified QEMU, an open source machine emulator that supports multiple popular operating systems, to collect coverage without instrumentation. To do this, we made the emulator produce a branch trace when it runs, which we can later parse to determine which elements of the object code were executed.
We compile the test program to an ELF file, so it runs “bare metal”, without an OS. If we didn’t do this, the generated trace would contain all the branches that executed in the kernel as well as in our program, and we would have to remove this data from the trace before subsequent processing.
We then run the trace through RapiCover to produce a coverage report. Figure 1 demonstrates the overall process on a snippet of code from the project.
Zero-instrumentation coverage on hardware
Okay, so we can collect coverage data without instrumentation from a simulator we have full control over – can we do the same from physical hardware, where we don’t have that control?
To explore this, we used Intel Processor Trace (IPT), a feature built into newer Intel chipsets that lets you collect branch trace information from CPU cores.
We turn on IPT via the Linux perf tool, and then run our program. Next, we use the IPT C library to decode the output data and produce a branch trace in a format that our tools can read.
IPT compresses data to reduce performance overheads, storing only whether each branch is taken or not. We can’t use the compressed data directly, as it isn't clear which branch is taken. To restore this information, we disassemble the program, generate a control flow graph (CFG) from the disassembly, and match elements in the CFG to the IPT trace.
Again, we use RapiCover to analyze the results. Figure 2 shows the overall process.
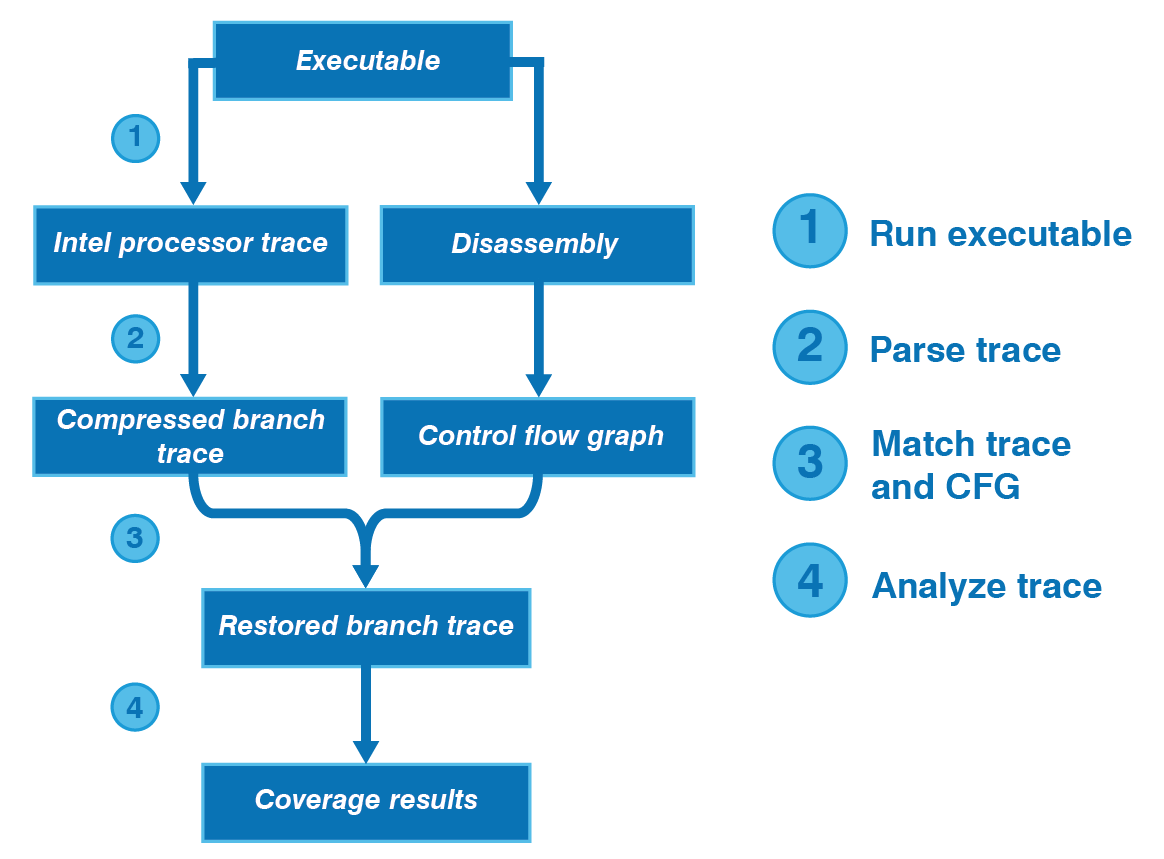
Figure 2. Process for collecting coverage via Intel Processor Trace
Closing remarks
A benefit of using branch traces to analyze structural coverage is that it means we can collect coverage from any executable written in any language, as long as we can obtain a disassembly of the object code. The programs we used while developing the Intel Processor Trace method, for example, were written in assembly language!
We’re continuing to explore new methods to collect coverage data with zero instrumentation. If you’re interested in obtaining zero-instrumentation coverage of your code, contact us to see how we can help.
DO-178C webinars

White papers
Mitigation of interference in multicore processors for A(M)C 20-193

Developing DO-178C and ED-12C-certifiable multicore software

Efficient Verification Through the DO-178C Life Cycle

A Commercial Solution for Safety-Critical Multicore Timing Analysis