Skip to main content
 Rapita System Announces New Distribution Partnership with COONTEC
 Rapita partners with Asterios Technologies to deliver solutions in multicore certification
 SAIF Autonomy to use RVS to verify their groundbreaking AI platform
 RVS gets a new timing analysis engine
 How to measure stack usage through stack painting with RapiTest
 What does AMACC Rev B mean for multicore certification?
 How emulation can reduce avionics verification costs: Sim68020
 How to achieve multicore DO-178C certification with Rapita Systems
 How to achieve DO-178C certification with Rapita Systems
 Certifying Unmanned Aircraft Systems
 DO-278A Guidance: Introduction to RTCA DO-278 approval
 The EVTOL Show
 NXP's MultiCore for Avionics (MCFA) Conference
 Embedded World 2026
 XPONENTIAL 2026


In a conversation with a colleague, I found myself wondering what was the impact of running code under Windows vs a "bare metal" x86 box. One of the nice things about working for a tool vendor is that you have the tools to hand to perform these kind of experiments "for fun".
In fact, rather than going for the full "bare metal" experience, I decided to compare code running under Windows 7 vs code running in the command line version of safe mode - which is considerably easier to do.
The interesting thing about using RapiTime to measure code running under Windows is that we can only measure response time - because to measure execution time, we would have to have some way of recording when context switches occur (see our earlier blog post to understand the difference between execution time and response time).
Taking our simple "message handler" code (which ships with the trial version of RVS), instrumenting it for RapiTime and compiling it with the x86 GCC compiler, I then ran the code in normal (unsafe?) mode Windows 7 and in safe mode. Collecting the results and analysing them with RapiTime, I got the following time profiles:
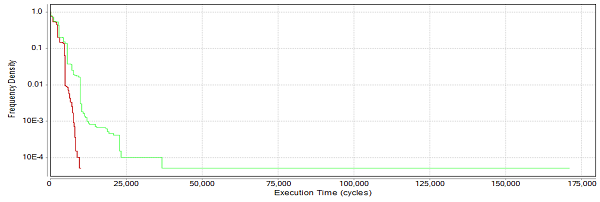
Figure 1: Time profiles in Windows 7 and safe mode
The red line shows the distribution of response times for the safe mode execution, and the green line for normal mode.
This graph shows 1-cumulative frequency of response time. From this graph, the fraction of all executions that exceed some time can be found by looking up the response time on the x-axis, and reading the corresponding value from the y-axis.
From the graph, we can see that in about 90% of the executions (frequency density 0.1 and above), the time distributions for the two modes are similar - around 5000 cycles or less. Only in a very few cases (0.01% of the time) do the execution times diverge wildly between the two cases - with the Windows 7 executable taking up to 17x the response time of the safe mode's time.
It's interesting to dig into the detailed timing of one specific function - in this case, it's a function with little timing variability:
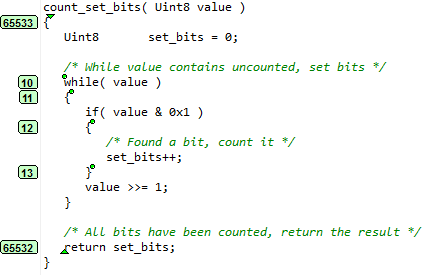
Figure 2: Detailed timing of one specific function
Looking at the timing of the block of code corresponding to Ipoint 13 ("set_bits++"):
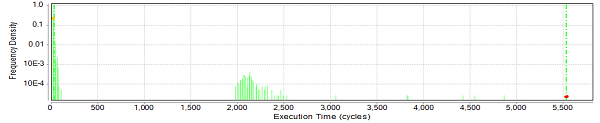
Figure 3: The "non-cumulative" form of the profile
As can be seen, the bulk of the executions occur within a very small window of time (less than 120 cycles). There is another cluster of executions that take place in the 2,000-2,500 cycle range and a longer tail going out to the 5,500 range. It seems reasonable to infer that even in safe mode an interrupt occurs approximately 0.3% of the times that this code is executed, and that the interrupt typically takes between 2,000 and 2,500 cycles (it exceeds this range about 5% of the time that the interrupt is executed). Based on the set of observations we've made, there seems to be an upper bound just in excess of 5,500 cycles.
Looking at the range of executions that are not being interrupted (24 to 108 cycles with a weighted average of 27.26 cycles), given that the interrupt occurs about 0.3% of the number of times that this code executes, we can infer that the interrupt occurs approximately once every 10,000 cycles. This assumes that the interrupt can occur at any line of code with equal probability.
Interestingly, even within the 24-108 cycle range, the times in excess of 68 cycles only occur rarely (6.4% of the time - 1.2% for times in excess of 80 cycles), and this could also be accounted for by some hardware phenomenon such as DRAM refresh.
Examining other pieces of code in the safe mode execution show a very similar picture - there is a narrow cluster of execution times at the left hand side of the graph that occur "most of the time", with another block of execution times in the range 2,000-2,500 cycles and a lower frequency range of execution times above this. If we wanted to exclude context switching from these results, it would be possible to adopt the following approach:
- at each linear piece of code, check to see that the majority of executions are less than (say) 500 cycles and that no executions occur between 500 cycles and 1900 cycles.
- filter out any executions for that piece of code that exceed 500 cycles.
This would allow us to perform execution time measurements on code with a reasonable degree of confidence. The same picture for the Windows 7 execution of block 13 is as follows:
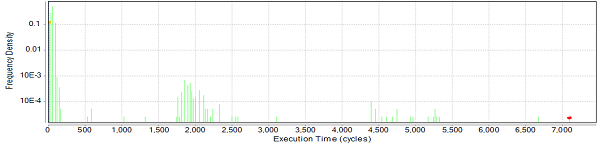
Figure 4: Windows 7 execution of block 13
Again we see the big cluster of times at the left hand end of the graph, and the cluster of execution times around the 2,000 cycle mark, with the long tail (in this case, going out to above 7,000 cycles). What is different here is the occurrence of other execution times at around 500, 1,000 and 1,300 cycles. In both cases, the percentage of times exceeding 500 cycles is about the same (about 0.3-0.4%). However, normal mode Windows has much more variable execution times, which are harder to take account of.
What started out as a "for fun" exercise has shown how, using RapiTime, it's possible to pull out a huge amount of detail in a short amount of time.
DO-178C webinars

White papers

Mitigation of interference in multicore processors for A(M)C 20-193

Developing DO-178C and ED-12C-certifiable multicore software

Efficient Verification Through the DO-178C Life Cycle

A Commercial Solution for Safety-Critical Multicore Timing Analysis